Today, simply having a professional website for your business or online store is no longer enough. You also need to be able to analyze every aspect of that site, including traffic types, conversion rates, what your competitors are doing, and so on. You must also be able to understand your customers’ various needs and have a thorough grasp of their expectations at any time of the year.
Ideally, you’ll also need information such as your busiest days and hours, the best time of year for sales, your most popular products among customers, and so on. For any entrepreneur looking to grow their business, all of this information is absolutely essential. This applies equally to a brick-and-mortar business and to a website. Here, we’d like to introduce you to a tool offered by Google that will help you analyze your business website in great detail. It’s called Google Analytics. So, how do you use Google Analytics?
Google Analytics: What Is It?
To begin with, it’s important to truly understand what Google Analytics is. For those who have never had the chance to use it, it’s simply a service or tool offered by Google. It’s software designed to help you gather information about how your website is performing.
You can use it to collect data that will be essential foranalyzing your website’s performance. What we like most about this tool is that it’s completely free and accessible to everyone. Even though it’s free, Google Analytics is a very comprehensive tool, as it consolidates various metrics into a single, well-organized table.
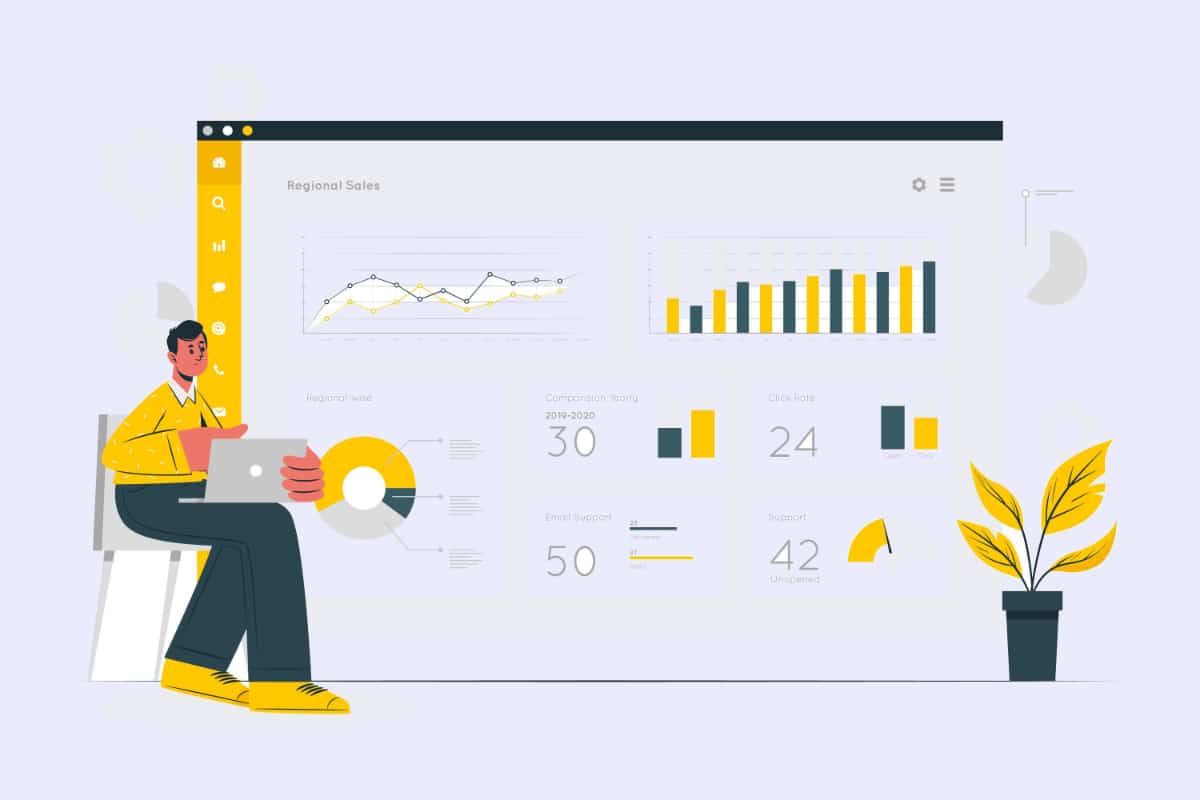
In fact, all the information about your website's performance is compiled in Google Analytics in an easy-to-understand dashboard. You can use this dashboard to better understand the behavior of website visitors or your online community.
With this tool, you’ll be able to better understand your audience and identify opportunities to grow your business. In fact, with Google Analytics, it will be easier for you to identify the strategies that work best with your audience, the areas you need to improve to enhance the user experience, and how satisfied your customers are.
Who can use Google Analytics?
You might think that a tool as powerful and comprehensive as Google Analytics would be reserved for web development professionals, but that’s far from the case. In fact, thisservice offered by Googleis available to anyone. All you need is a Google account, and you’ll be able to use the Google Analytics extension.
This is atracking toolthat is an absolute must-have for anyone with a website. If you want to use it, you’ll needto install the Google Analytics codeonyour site. Once that’s done, the software will generate and regularly provide you with a detailed statistical report about your website.
People who aren't very familiar with the subject may need professional help to quickly and effectively set up Google Analytics on their website. However, in most cases, all you need to do is follow a few very simple steps to install and activate this tool on your website.
How do you analyze your audience using Google Analytics?
For those wondering how to use Google Analytics to analyze their online audience, keep in mind that you’ll need to master the various features of this software. In fact, if you want to take advantage of the analytics and data provided by Google Analytics regarding your website’s performance, you must be able to interpret them.

Otherwise, all this data would be of no use to you. It’s important to know that setting up a Google Analytics account gives you access to a wealth of information. Even though this information is organized in a dashboard, you may sometimes find it difficult to make sense of it all. The best way to make effective use of Google Analytics is, first and foremost, to learn how to interpret the data the tool provides. This will help you avoid getting lost in a sea of numbers and allow you to select only the data you need to analyze your performance. To that end, here’s a detailed explanation of the information you’ll find in the various sections of Google Analytics.
Overview of the hearing
To analyze your audience in Google Analytics, we provide an "Overview" section. This is a very basic report that offers a general overview of the various activities on your site over a given period. Here, you'll find several subheadings on the dashboard.
Sessions
This refers to the total number of times your website was visited during a predefined period. This figure also includes returning visitors.
Users
This figure represents the total number of visitors who landed on your website during a given period. In other words, unlike the "Sessions" section, here you can see how many unique visitors have visited your site.
Page Views
Page views represent the total number of pages on your site that were visited by your community or by Internet users during a given period.
Average session duration
As you might expect, this section provides information on the average duration of visits to your site. In other words, it refers to the average amount of time a visitor spends on your website.
Bounce Rate
At this level, you’ll find a metric that gives you an idea of the proportion of visitors who viewed only one page on your site. This data is expressed as a percentage and should be as low as possible. In fact, the higher a website’s bounce rate, the more it indicates that visitors weren’t interested enough to explore further or to become potential customers.
Percentage of new sessions
Here, you'll see the percentage of people or web users who visited your site for the first time.
It’s important to note that the data analysis period in Google Analytics can easily be adjusted to suit the user’s needs. Simply go to the upper-right corner of your screen, and you can select the date or time period you want to analyze. Then, click “Apply,” and you’ll have all the data you need for your analysis.
Acquisition Overview
In addition to the audience section, you’ll also find an “Acquisition” section on the Google Analytics dashboard. This section provides adetailed report on whereyour website’straffic comes from. In other words, if you want to know how users hear about your site and find their way to your web pages, this is the section you need to analyze.
At this level, you’ll have access to all kinds of statistical data, just as in the previous section. The information provided here will help you determine exactly whether your strategies and efforts to attract visitors to your site are effective. It’s important to note that Google Analytics recognizes four different traffic acquisition channels. These are:
Social
This traffic acquisition channel relates to social media. Here, you'll see the number of clicks you've generated through your social media posts.

Live
This figure shows the total number of internet users who typed your URL directly into their browser. Generally, this category includes people who discovered your site through friends and family or by word of mouth.
Referral
In this section, you can see the various websites that have linked to your site, thereby helping to increase your traffic. This refers to the number of sites that, through their content, have driven traffic to your site. Getting a sense of these sites can help you build a network to further increase their impact on your traffic.
Organic Search
For websites that make it a priority to improve their organic search rankings through various strategies, this section allows you to analyze the results of your efforts. Here, you can obtain information about the traffic your site receives through organic search. Consequently, this section analyzes the search engines that rank your content. You can see which keywords perform best and help direct users to your website.
Track Conversions
To analyze your audience in Google Analytics, you also need to track your conversions. You’ll find the “Conversions” section, which leads to another section called “Goals,” which in turn provides an overview of the topic. At this point, the first thing to keep in mind is that the primary goal of a website is to convert visitors—that is, to get them to take a specific action.
You need to successfully convert them from mere visitors or prospects into customers. To achieve this ultimate goal, you can implement various actions for your visitors to take. Your website can therefore aim to encourage your audience to sign up for your newsletter, make purchases, or simply fill out a contact form.
Thus, we speak of an effective conversion when the website’s goal has been achieved. Based on this principle, it becomes clear that having high traffic on a website is actually pointless if the conversion rate is low. That’s why Google Analytics allows you to better track conversions on your website. All you have to do is set a goal. Then, in just a few minutes, you’ll know whether your website is performing well enough to achieve its goal.
Monitor the bounce rate of pages
With Google Analytics, you can also get an overview of your pages’ bounce rates. However, this isn’t enough to understand the real issues you need to address in order to successfully engage customers. That’s why Google Analytics also includes a “All Pages” section.
This is a detailed report on each page of your website, which can help you better understand the cause of a potentially high bounce rate. For those wondering when to start worrying about their bounce rate, keep in mind that ideally, itshould not exceed 40%.
It’s worth noting, however, that a high bounce rate can make perfect sense in some cases, especially if your website is actually a blog. Indeed, if visitors come to your site to read an article, it’s normal for them to leave the page and the site once they’ve finished reading. In any case, it’s always a good idea to take a closer look at the bounce rate, because in most cases, a high bounce rate indicates a poor user experience.
The devices used by your visitors
With Google Analytics, you can also get information about the devices used by visitors to your site. In this regard, it’s important to note that for the past few years, Google search results have been ranked in a way that prioritizes websites optimized for mobile devices’ smaller screens.
Therefore, if you have a website that isn't yet optimized for mobile devices, or that doesn't function properly on such devices, you risk losing some of your visitors.
So, if an analysis of the devices used by your website visitors reveals that most of your traffic comes from laptops or desktop computers, you’ll know you have nothing to worry about. On the other hand, if it turns out that most of your site’s users access it from their mobile devices, you’ll know that it’s essential to make your site compatible with these types of devices in order to increase your traffic.

Check out the site's most popular content
Finally, Google Analytics can also analyze the various pages on your site to identify which ones seem to generate the most interest among visitors. In other words, you can determine which content on your website is the most effective. With this information, you’ll be able to more easily identify the type of content or data that interests your visitors the most.
How to Use Google Analytics: A Summary
You can also draw inspiration from your most popular content to create new pieces that might also be successful. In addition, you’ll be able to analyze the various metrics and features of your popular page, including the path from your homepage to that page, the channels users take to reach it, and so on. Basically, this page will help you figure out what you need to do to grab your users’ attention and spark their interest.
As you’ve seen, the statistics provided by Google Analytics can be very useful for improving your website—and, by extension, your business. Therefore, if your company finds the vast majority of its customers online, it’s essential that you learn how to use Google Analytics and how to interpret the data it provides so you can use it to make your website more effective.